GRAPHS & TENSORS
Information
Graphs & Tensors
A graph is an abstract data type that is meant to implement the undirected graph and directed graph concepts from the field of graph theory within mathematics.
A graph data structure consists of a finite (and possibly mutable) set of vertices (also called nodes or points), together with a set of unordered pairs of these vertices for an undirected graph or a set of ordered pairs for a directed graph. These pairs are known as edges (also called links or lines), and for a directed graph are also known as edges but also sometimes arrows or arcs. The vertices may be part of the graph structure, or may be external entities represented by integer indices or references.
A tensor is an algebraic object that describes a relationship between sets of algebraic objects related to a vector space. Objects that tensors may map between include vectors and scalars, and even other tensors. There are many types of tensors, including scalars and vectors (which are the simplest tensors), dual vectors, multilinear maps between vector spaces, and even some operations such as the dot product. Tensors are defined independent of any basis, although they are often referred to by their components in a basis related to a particular coordinate system.
Publication
- Sunhwa Jo, Beomjun Park, Suan Lee, and Jinho Kim
- Applied Sciences
- April 2021
Abstract
Real-world systems that are composed of various types of components, their interactions, and relationships, and numerous applications are often modeled as graphs or network structures to represent and analyze the presence of relationship, shape, and meaning of objects. Network-structured data are used for various exploration and in-depth analysis through visualization of information in various fields. In particular, online bibliographic databases are a service that is used for a myriad of purposes, such as simple search of research materials as well as understanding the history and flow of research, current status, and trends. A visualization tool that can intuitively perform exploration and analysis by modeling the data provided by the online bibliographic database in a network structure will be a very meaningful study for the exploration of various information using a large amount of complex bibliographic data. This study has modeled an online bibliographic database as an information network, and further developed a prototype of a visualization tool that provides an interactive interface for easily and efficiently performing visual exploration and multidimensional analysis. The visualization tool that was developed through this study will be used to conveniently perform various online analysis of the bibliographic data, and the information and knowledge acquired as a result of the analysis are expected to contribute to the research development of various researchers. Furthermore, this visualization tool can be applied to other types of data in the future, and it is expected to develop into a useful tool for various information network analysis by improving, supplementing, and expanding the functions and performance of the developed prototype.
Keywords
bibliographic information network; Information Network OLAP; information network visualization
- Minkyu Kim and Suan Lee
- Big Data and Smart Computing (BigComp), 2021 IEEE International Conference on. IEEE, 2021.
- January 17-20, 2021
Abstract
Those who want to start their own businesses must decide a location and service to start. In order to make the decision, they must know characteristics of the location and service, such as average revenues and floating population. However, it is usually very difficult to collect and analyze these characteristics. Therefore, we propose a novel deep learning model named Neural Tensor Factorization (NeuralTF) that automatically analyzes the characteristics for predicting revenues, and a method for recommending appropriate location or service to start their businesses based on the predicted revenues. NeuralTF is a combination of Tensor Factorization(TF) and Deep Neural Network(DNN). We compare NeuralTF with other machine learning models using Seoul Commercial Alley dataset. In addition, we compare performances of NeuralTF when TF and DNN components share the embedding space and when they do not.
Keywords
Recommender System, Tensor Factorization, Neural Network, Deep Learning, Neural Tensor Factorization
- Seok Kang, Suan Lee, and Jinho Kim
- Cluster Computing
- October 2020
Abstract
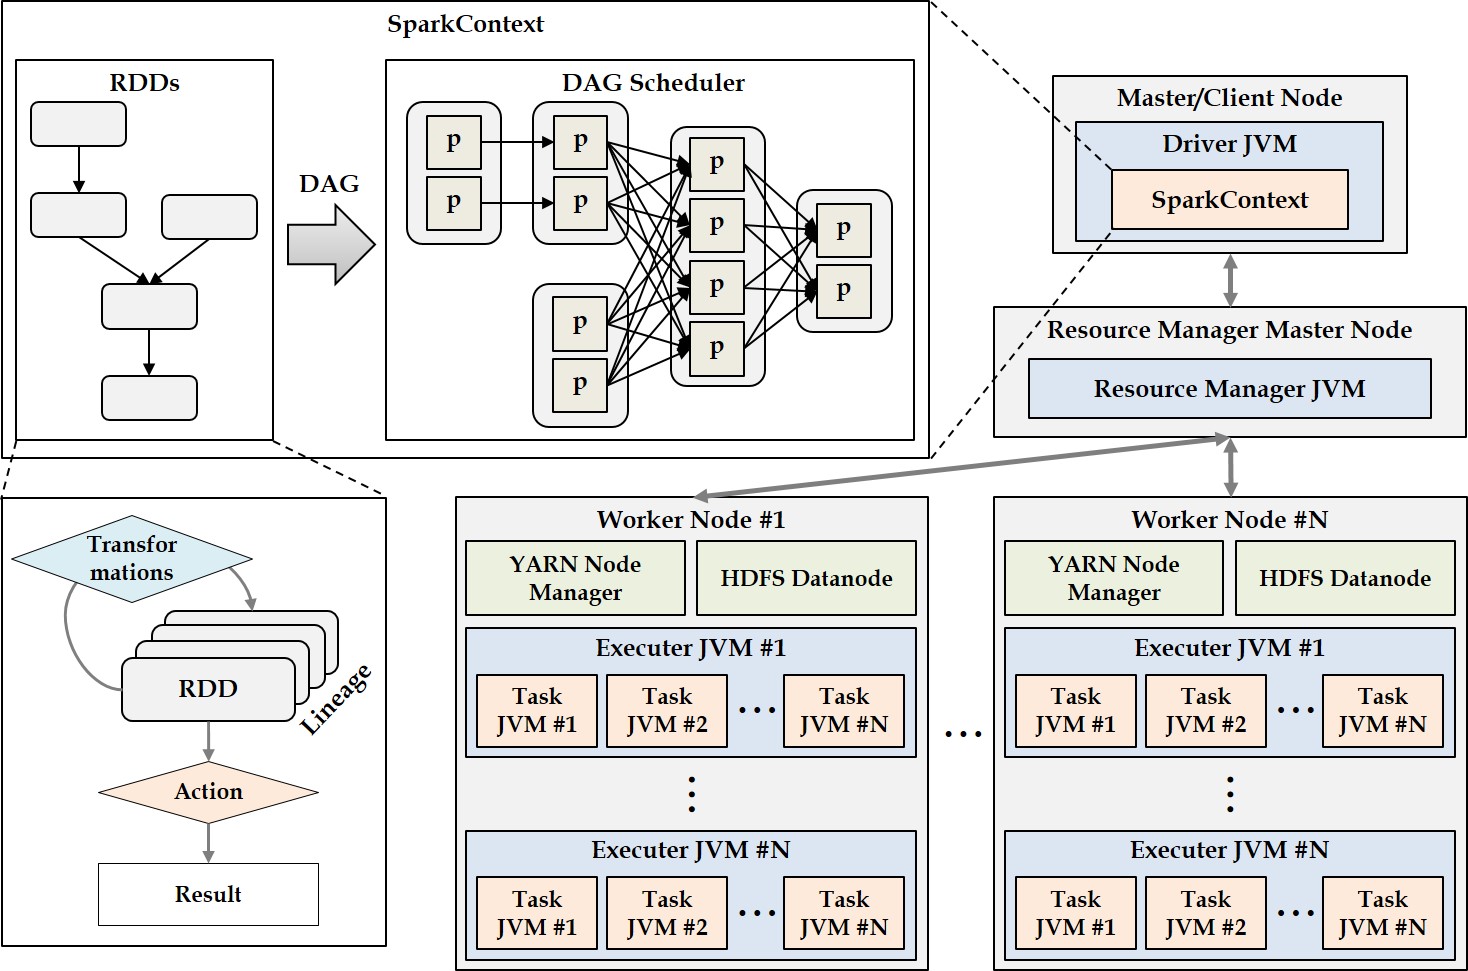
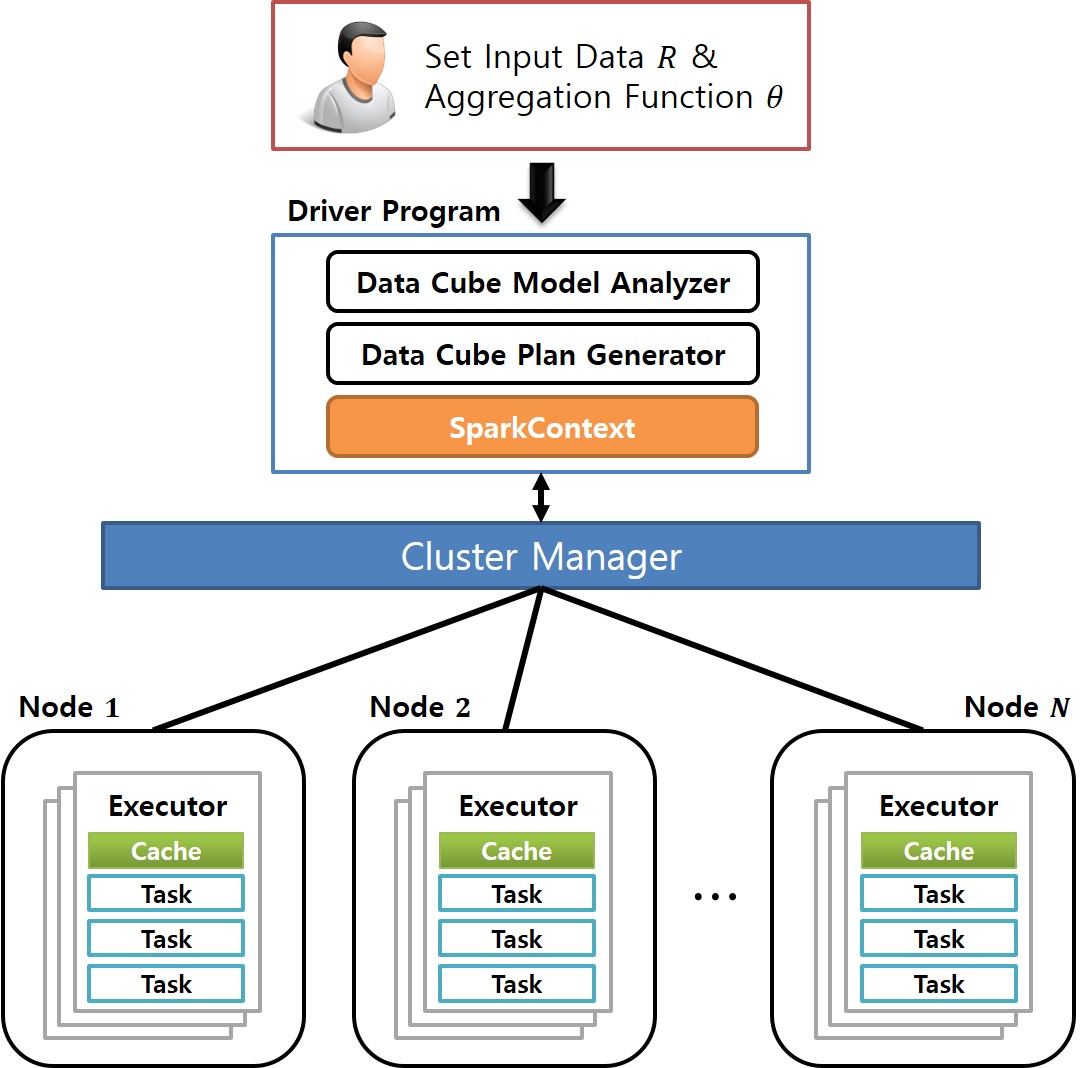
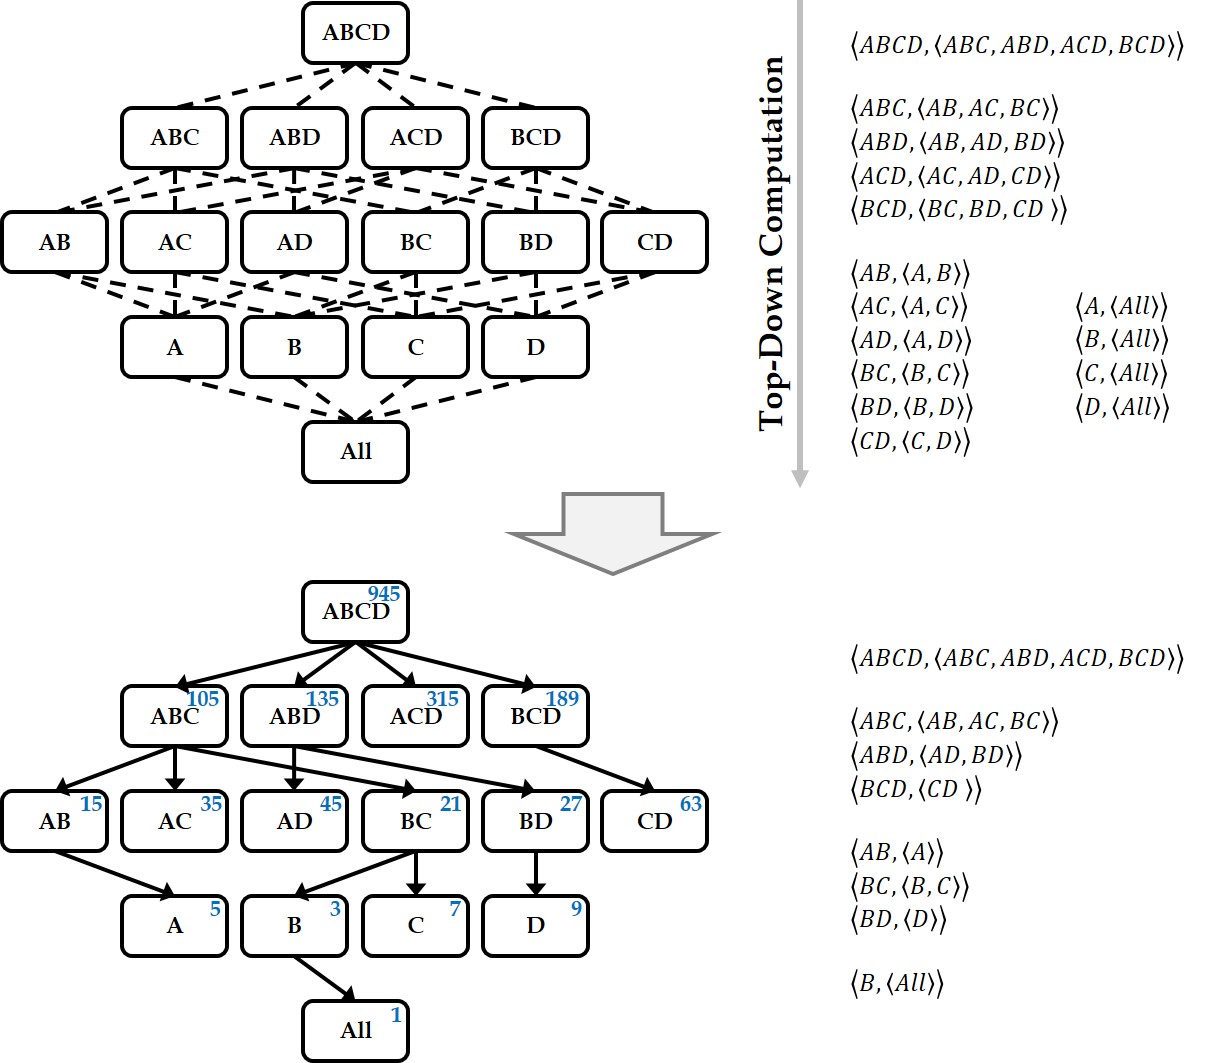
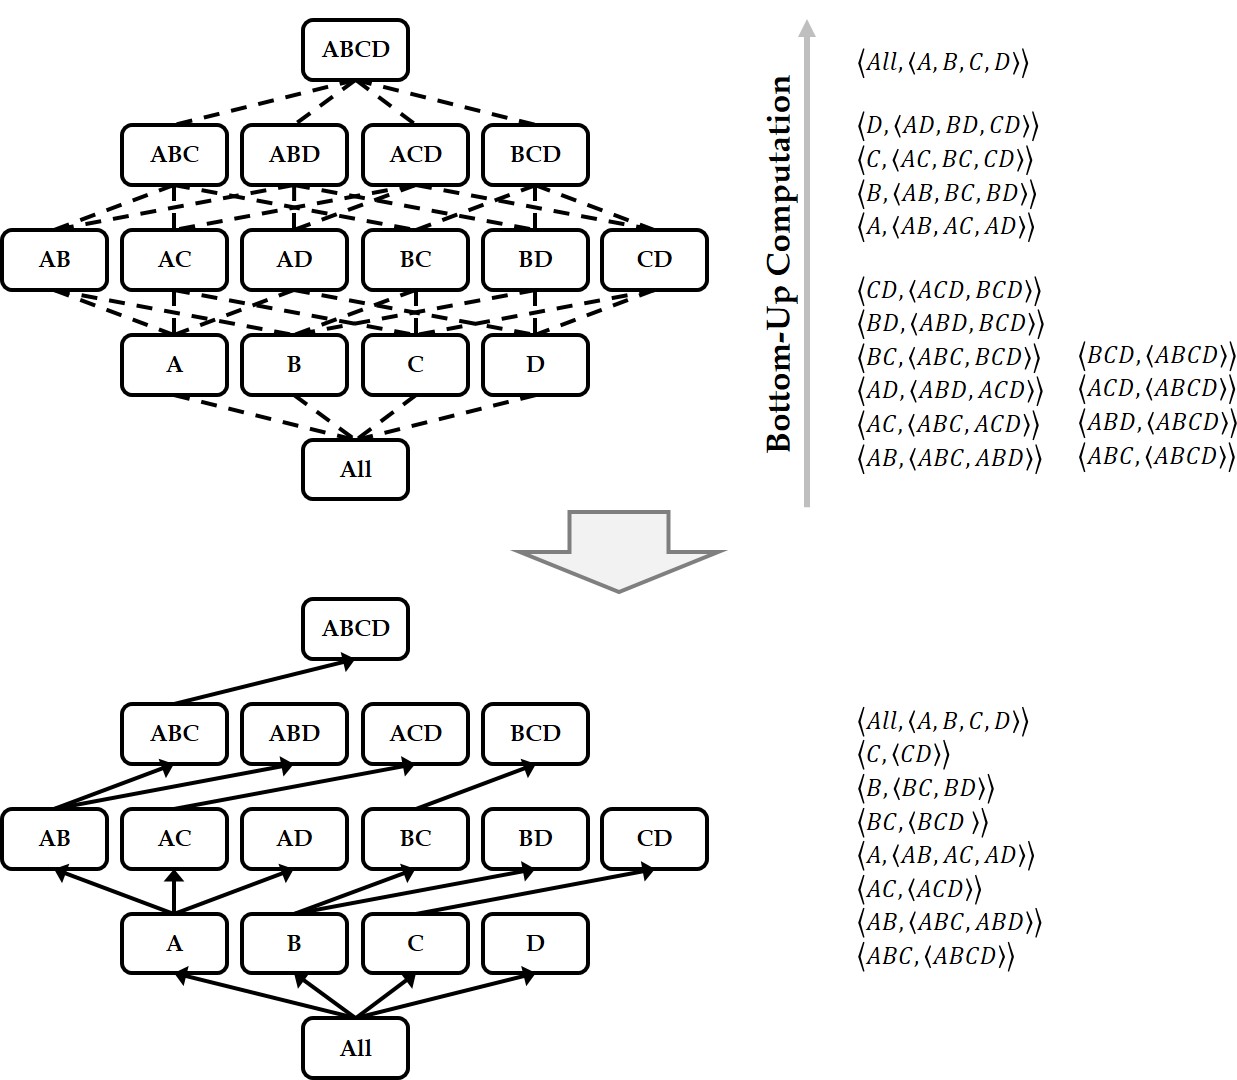
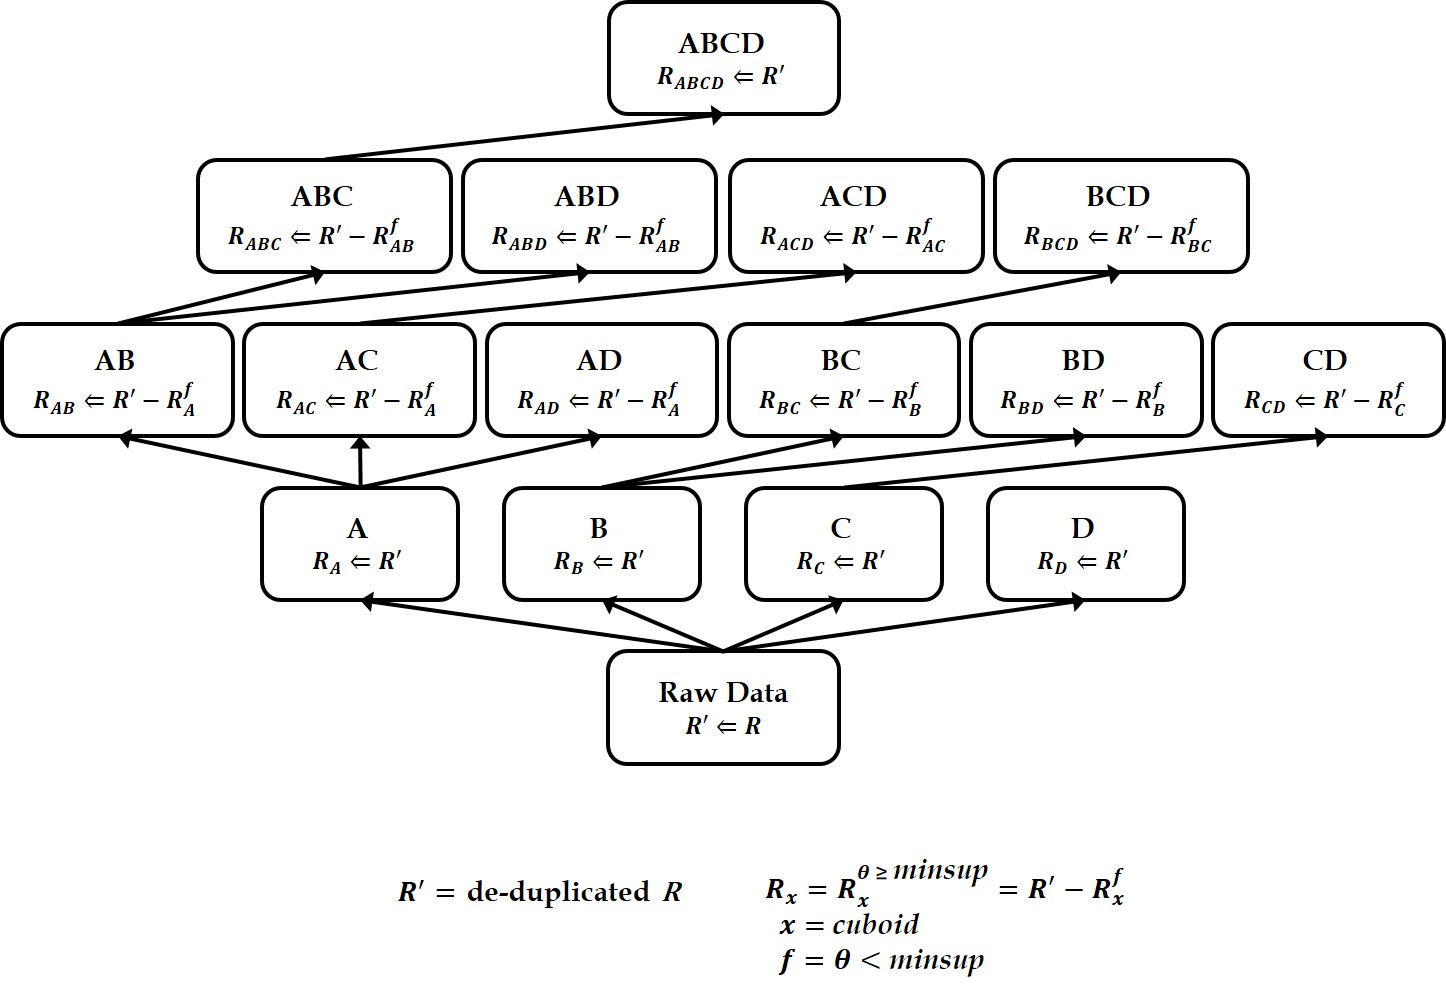
Graph OLAP is a technology that generates aggregates or summaries of a large-scale graph based on the properties (or dimensions) associated with its nodes and edges, and in turn enables interactive analyses of the statistical information contained in the graph. To efficiently support these OLAP functions, a graph cube is widely used, which maintains aggregate graphs for all dimensions of the source graph. However, computing the graph cube for a large graph requires an enormous amount of time. While previous approaches have used the MapReduce framework to cut down on this computation time, the recently developed Spark environment offers superior computational performance. To leverage the advantages of Spark, we propose the GraphNaïve and GraphTDC algorithms. GraphNaïve sequentially computes graph cuboids for all dimensions in a graph, while GraphTDC computes them after first creating an execution plan. We also propose the Generate Multi-Dimension Table method to efficiently create a multidimensional graph table to express the graph. Evaluation experiments demonstrated that the GraphTDC algorithm significantly outperformed Spark SQL’s built-in library DataFrame, as the size of graphs increased.

Keywords
Distributed parallel processing, Spark framework, Resilient distributed dataset, Graph cube, Data cube, Online analytical processing
- Svetlana Kim, Suan Lee, Jinho Kim, and Yong-Ik Yoon
- The Journal of Supercomputing
- October 2020
Abstract
Context information can be an important factor of user behavior modeling and various context recognition recommendations. However, state-of-the-art context modeling methods cannot deal with contexts of other dimensions such as those of users and items and cannot extract special semantics. On the other hand, some tasks for predicting multidimensional relationships can be used to recommend context recognition, but there is a problem with the generation recommendations based on a variety of context information. In this paper, we propose MRTensorCube, which is a large-scale data cube calculation based on distributed parallel computing using MapReduce computation framework and supports efficient context recognition. The basic idea of MRTensorCube is the reduction of continuous data combined partial filter and slice when calculating using a four-way algorithm. From the experimental results, it is clear that MRTensor is superior to all other algorithms.
Keywords
Context awareness, Tensor data cube, MapReduce framework
- 박범준, 조선화, 이수안, 신지운, 유혁상, 김진호
- 한국빅데이터학회지, 한국빅데이터학회
- 2020년 08월
Abstract
최근 다양한 실세계의 복잡한 관계를 그래프의 형태로 구성하고 분석하는 다양한 연구들이 진행되고 있다. 특히 DBLP와 같은 컴퓨터 분야 문헌 데이터 시스템은 논문의 저자, 그리고 논문과 논문들이 서로 인용 관계로 표현되는 대표적인 그래프 데이터이다. 그래프 데이터는 저장 구조 및 표현이 매우 복잡하므로, 문헌 빅데이터의 검색과 분석, 그리고 시각화는 매우 어려운 작업이다. 본 논문에서는 문헌 빅데이터를 그래프의 형태로 시각화한 그래픽 사용자 인터페이스 도구, 즉 EEUM을 개발하였다. EEUM은 그래프 데이터를 시각적으로 표시하여 연결된 그래프 구조에 따라 문헌 데이터를 브라우징 하는 기능을 제공하며, 문헌 빅데이터에 대한 검색 및 관리, 분석이 가능하도록 구현하였다. 또한 EEUM을 DBLP가 제공하는 문헌 그래프 빅데이터에 적용하여 편리하게 검색, 탐색 및 분석하는 할 수 있음을 시연한다. EEUM을 이용하여 모든 연구 분야에서 영향력 있는 저자나 논문을 쉽게 찾을 수 있으며, 여러 저자와 논문 사이의 모든 관계를한 눈에 볼 수 있는 등 복잡한 문헌 그래프 빅데이터의 검색 및 분석 도구로 편리하게 사용할 수 있다. Recently, many researches habe been done to organize and analyze various complex relationships in real world, represented in the form of graphs. In particular, the computer field literature data system, such as DBLP, is a representative graph data in which can be composed of papers, their authors, and citation among papers. Becasue graph data is very complex in storage structure and expression, it is very difficult task to search, analysis, and visualize a large size of bibliographic big data. In this paper, we develop a graphic user interface tool, called EEUM, which visualizes bibliographic big data in the form of graphs. EEUM provides the features to browse bibliographic big data according to the connected graph structure by visually displaying graph data, and implements search, management and analysis of the bibliographc big data. It also shows that EEUM can be conveniently used to search, explore, and analyze by applying EEUM to the bibliographic graph big data provided by DBLP. Through EEUM, you can easily find influential authors or papers in every research fields, and conveniently use it as a search and analysis tool for complex bibliographc big data, such as giving you a glimpse of all the relationships between several authors and papers.
Keywords
그래프 데이터, 문헌 빅데이터, 그래픽 인터페이스, 시각화 도구 Graph Data, Bibliographic Big Data, Graphic Interface, Visualization Tool
- SungJin Park, Suan Lee, and Jinho Kim
- Big Data and Smart Computing (BigComp)
- February 19-22, 2020
Abstract
As for people who wish to start their own businesses, their concerns are whether they could survive during their operations because most stores or services in Seoul are not able to survive for more than 5 year possibly due to the poor decision of location/service to start. In order to solve this problem, using big data could be helpful to increase the survival rate. Singular Value Decomposition (SVD) has been widely used in finding the similarity between all pairs of alleys and obtaining predictions from unknown relevance scores. Since tensor decomposition is the extension of SVD for multi-dimensional data, using this method to find the similarity between all pair of alleys could be the solution of increasing survival rate. This paper aims to generate good prediction tensor, TENSORCABS, that is able to recommend users appropriate alley location to start their businesses or the appropriate services to start at the user’s desired location. Both CP and Tucker decompositions are used and compared to evaluate which method has better performance. Also, r-square for regression problem and precision & recall for top-k recommendation performance are used to evaluate the TENSORCABS. As results, actual and predicted values are good-fitted, and prediction tensor performs well on the top-k recommendation. In addition, Tucker outperforms CP for this situation. Therefore, the proposed method has advantages that can handle high-dimensional data and can use decomposition for recommendations of various perspectives. With this method, users are able to obtain recommendations of the appropriate alleys with predicted revenues for opening any business service or the appropriate services with predicted revenues on a user’s desired alley location.
Keywords
Recommendation System, Tucker Decomposition, Canonical Polyadic, Collaborative Filtering, Top-k Recommendation, Tensor, Commercial Alley
- Heesang Kim, Suan Lee, SungJin Park, and Jinho Kim
- The 2nd International Workshop on Big Data Analysis for Smart Energy
- 14 Oct. 2017
Abstract
Recently, several studies attempt to process big data using Apache Spark. In addition, spammers are increasing lately, and they are exposing indiscriminate information on social networks (SNS) that users do not want. Previous relationshipbased spammer detections are not suitable for big data graph, because the detecting spammers in big data graphs requires a long computation time. Therefore, we propose an efficient spammer detection scheme based on social relations using Strongly Connected Components (SCC), which quickly finds cyclical relationships on Spark GraphX. We test our proposed spammer detection method through experiments, and it is able to find spammers in big data graph quickly.
Keywords
Spammer, Spark, Strongly Connected Components, Social Networks
- Suan Lee, Young-Seok You, Sungjin Park, and Jinho Kim
- Proceedings of the Seventh International Conference on Emerging Databases: Technologies, Applications, and Theory
- 14 Oct. 2017
Abstract
A suitable user interactive model is required to navigate efficiently in information network for users. In this paper, we have developed EEUM (Explorable and Expandable User-interactive Model) that can be used conveniently and efficiently for users in bibliographic information networks. The system shows the demonstration of efficient search, exploration, and analysis of information network using EEUM. EEUM allows users to find influential authors or papers in any research field. Also, users can see all relationships between several authors and papers at a glance. Users are able to analyze after searching and exploring (or navigating) bibliographic information networks efficiently by using EEUM.
Keywords
Information networks, Graph database, Data visualization, User-interactive model
- Young Seok You, Suan Lee, and Jinho Kim
- Proceedings of the Sixth International Conference on Emerging Databases: Technologies, Applications, and Theory. ACM
- 17-19 Oct. 2016
Abstract
Typically, application or website shows the comments of people in a list format. This list means in seeing chronologically or log of recommends. However, it is difficult to grasp because of reading and knowing all countless comments of the topic at a glance. Therefore, it requires a lot of ability to grasp information at a glance via picking only the important information. In this paper, we design and develop a visualization tool that can identify a number of reviews containing comments on the movie at a glance. Review assumed to be extracted from the Amazon and IMDb that are both subjective information. The tool that we develop visualizes sentimental analysis of the review on pre-made Sentiment Dictionary with objective information of a movie. Our proposed system can search and display one or more movies. Users can determine the relationship between movies by clustering sentiment of positive/negative reviews and movie's factors. In the future, based on all the reviews on Amazon and grasp the reviews on a variety of movies and products, as well, it will be used as tools to help users of a rational choice.
Keywords
Review DAta, Sentiment Analysis, Visualization